Network Deep Dive: The Weather Channel
Recently, news broke that CF Entertainment, which owns The Weather Channel, is accusing Nielsen of “abusing its monopolistic power over television ratings to extort a massive windfall from a smaller market participant,” and as such, is suing the TV ratings behemoth. And in mid-April, the 4A’s (American Association of Advertising Agencies) came out in opposition to Nielsen’s announcement that it’s combining national in-home and out-of-home TV viewership into one data stream.
Nielsen, of course, has always had its critics. But it’s still essential, right? The answer may not be as simple as it used to be.
The pushback by CF Entertainment and the 4A’s comes at an awkward time for Nielsen, given the rise of other options for networks looking to put together a 360-degree view into viewer behavior and advertising performance. A look at the evolving TV-data landscape:
Smart TV Offers Real-Time Granularity at Scale
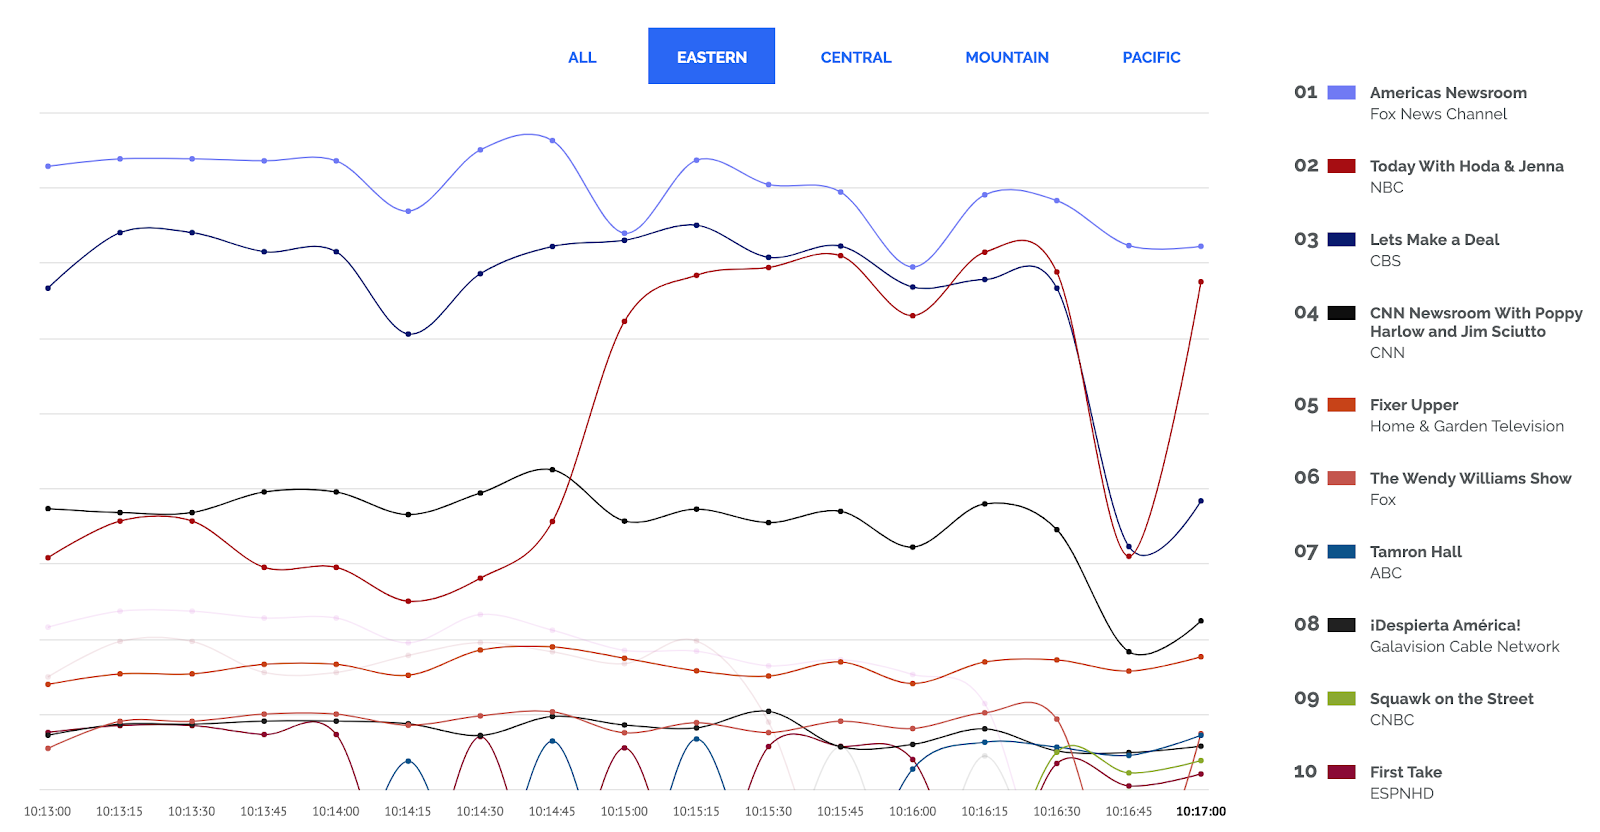
First off, viewership data down to a second-by-second look can be found using Inscape, the TV data company with glass-level insights from a panel of more than 14 million smart TVs. For instance, the chart below, available on Inscape’s website here, shows tune-in for the top 10 shows, refreshed every few seconds, and can be viewed by time zone.
Inscape can also show DMA tune-in for programs and channels. Below is a look at geographical viewership for The Weather Channel from Jan. 1 through April 27, 2020. (On the heatmap, the darker the color, the more households tuning in.)
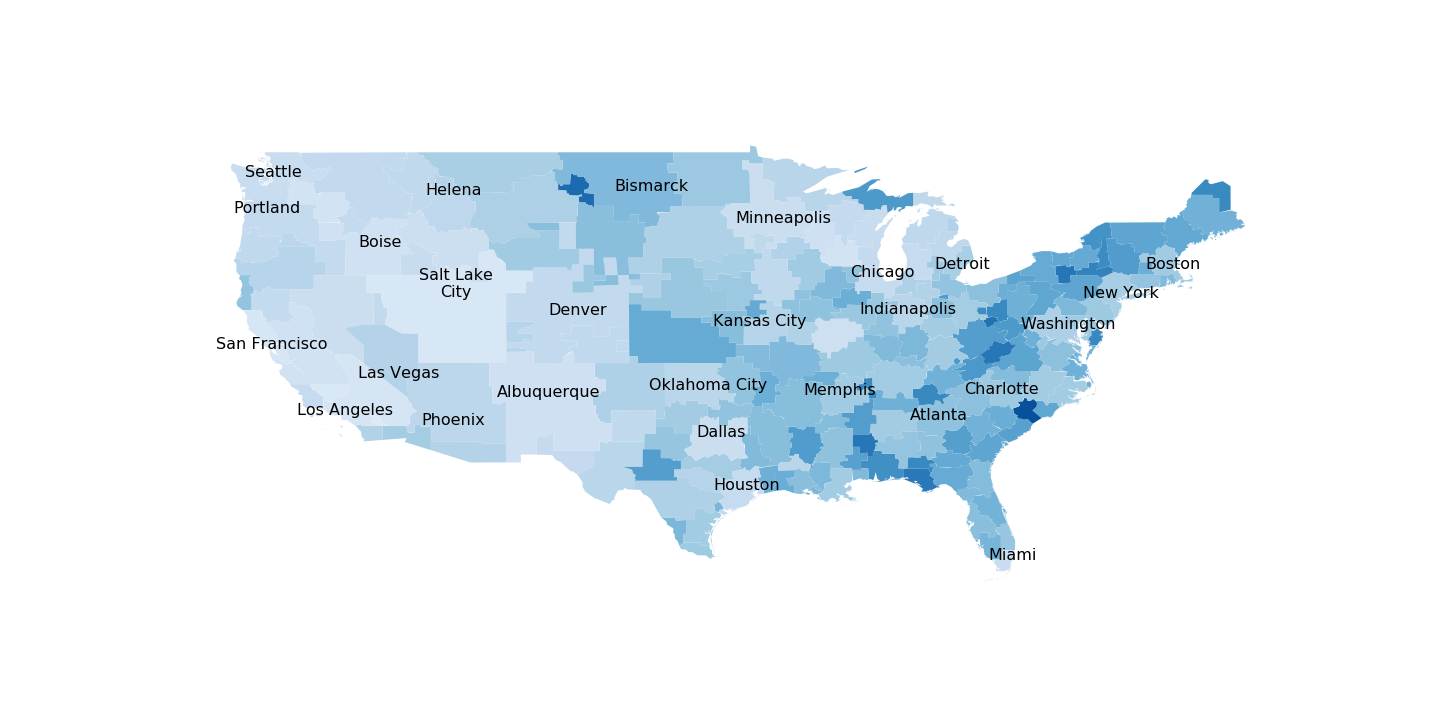
The top shows on the network during this time frame, based on the percent of households watching, included Highway Thru Hell, The Weather Channel LIVE, AMHQ, Weather Underground and Ice Pilots.
Below, a look at crossover viewership among these shows. (A note about methodology: You have to do more than just flip past a station with your remote to count as a “crossover viewer” in Inscape’s system. For the data below, the minimum viewing threshold is ten minutes.)
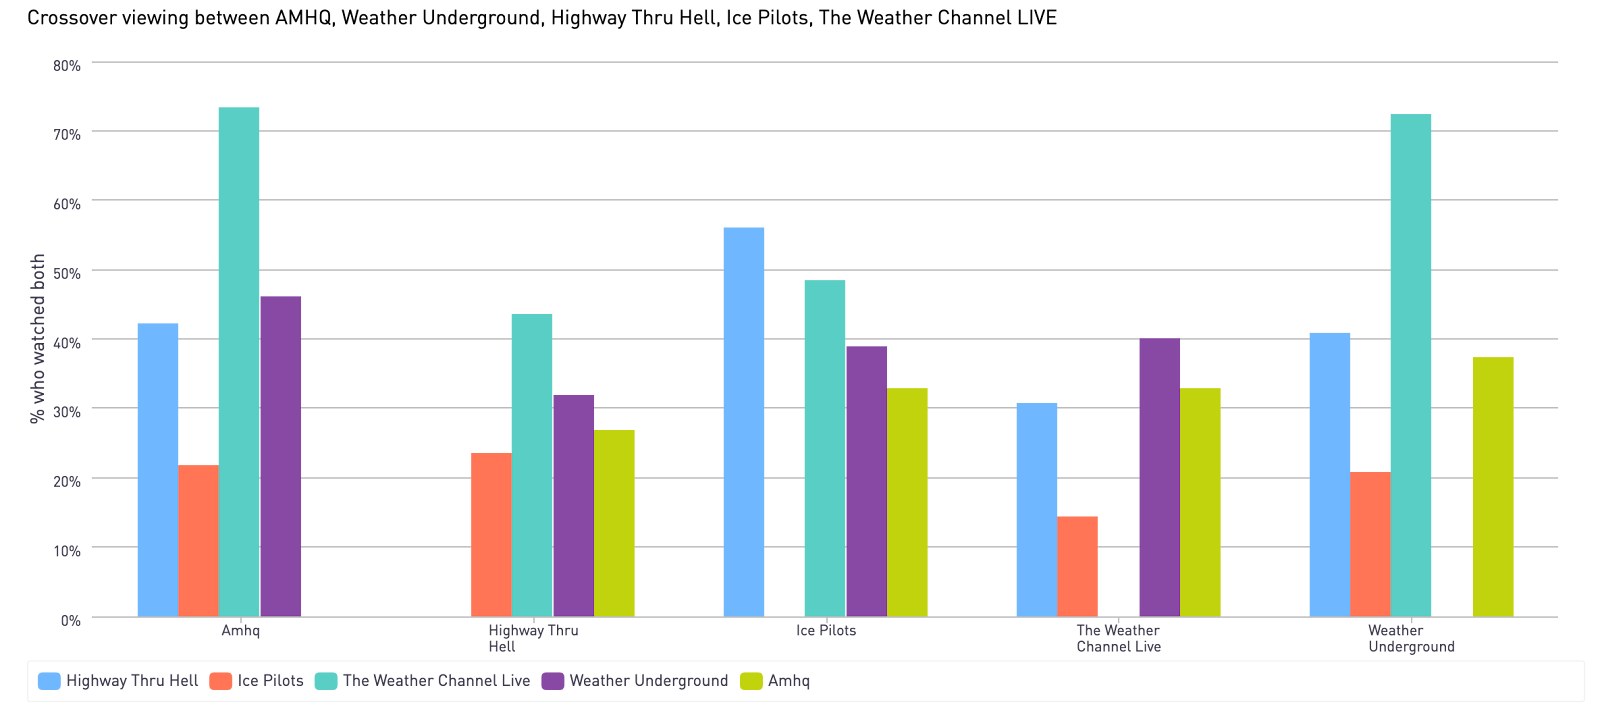
The highest crossover rates: 73% of AMHQ viewers also tuned into The Weather Channel Live, and 73% of Weather Underground viewers also watched The Weather Channel Live. On the low end: only 14% of The Weather Channel Live viewers watched Ice Pilots, and 21% of Weather Underground viewers checked out Ice Pilots.
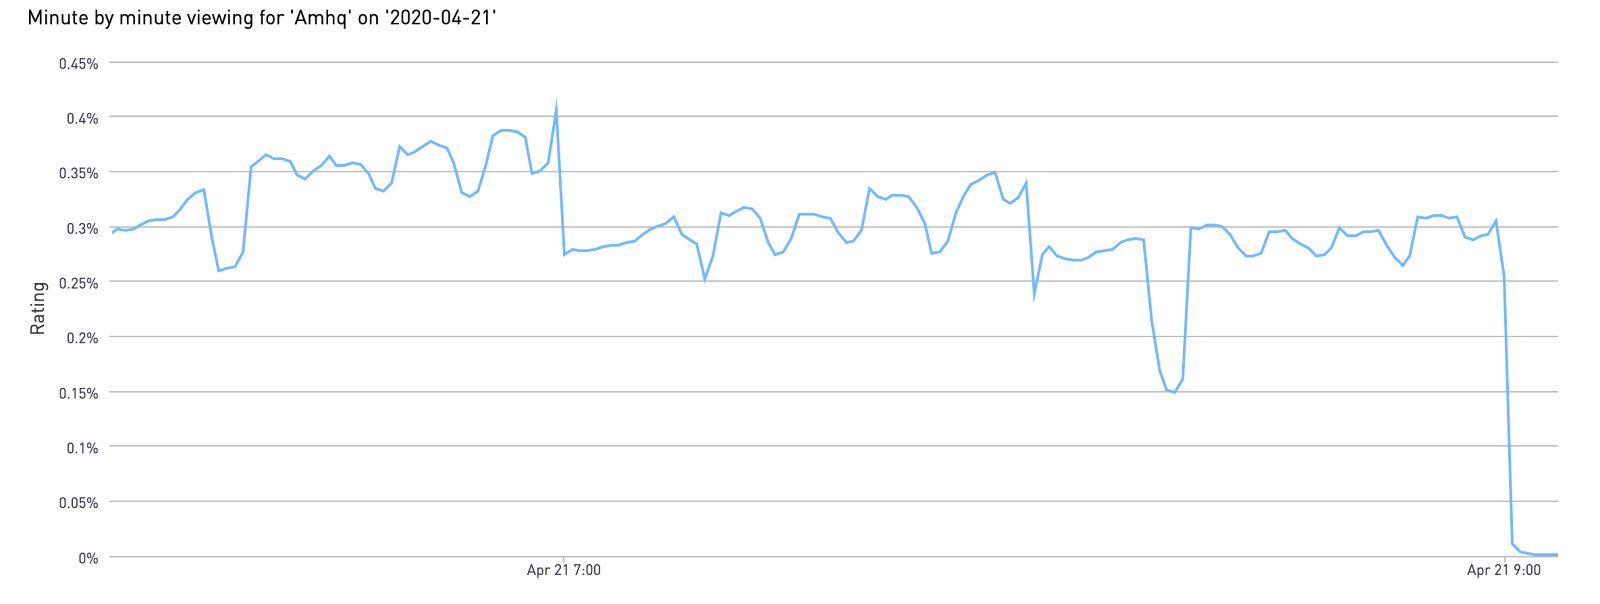
Diving even deeper, Inscape can reveal minute-by-minute trends for anything that airs on The Weather Channel. For example, here’s a look at viewership for the April 21 episode of AMHQ; the highest levels of tune-in occurred during the first hour.
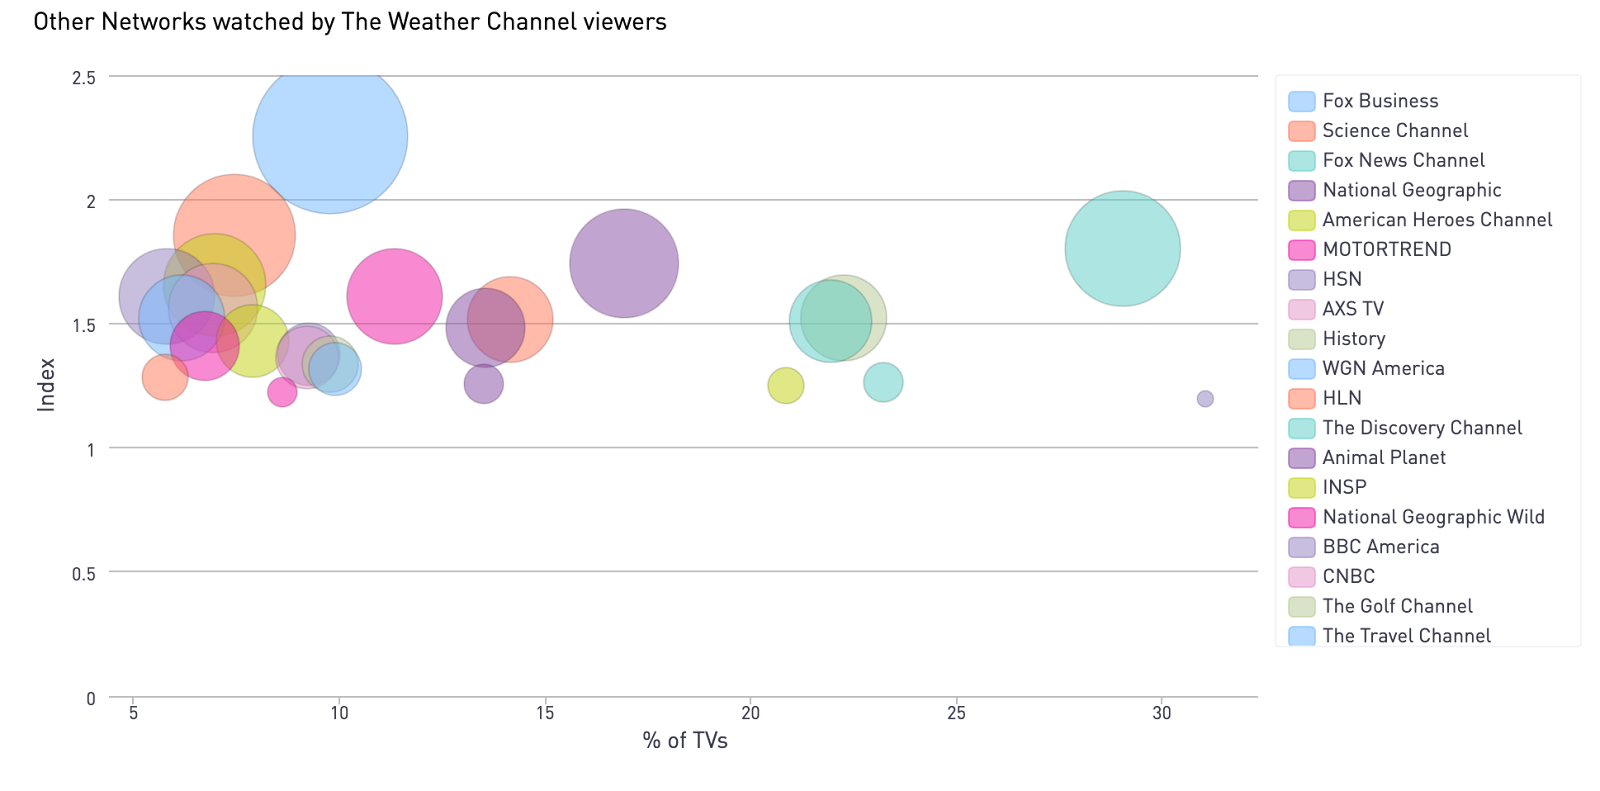
Going further, we can examine what other shows and networks were being watched by The Weather Channel viewers during the same time frame.
Among networks, The Weather Channel viewers are most likely to be watching other cable networks, with Fox Business, Science Channel, Fox News, National Geographic and American Heroes Channel leading.
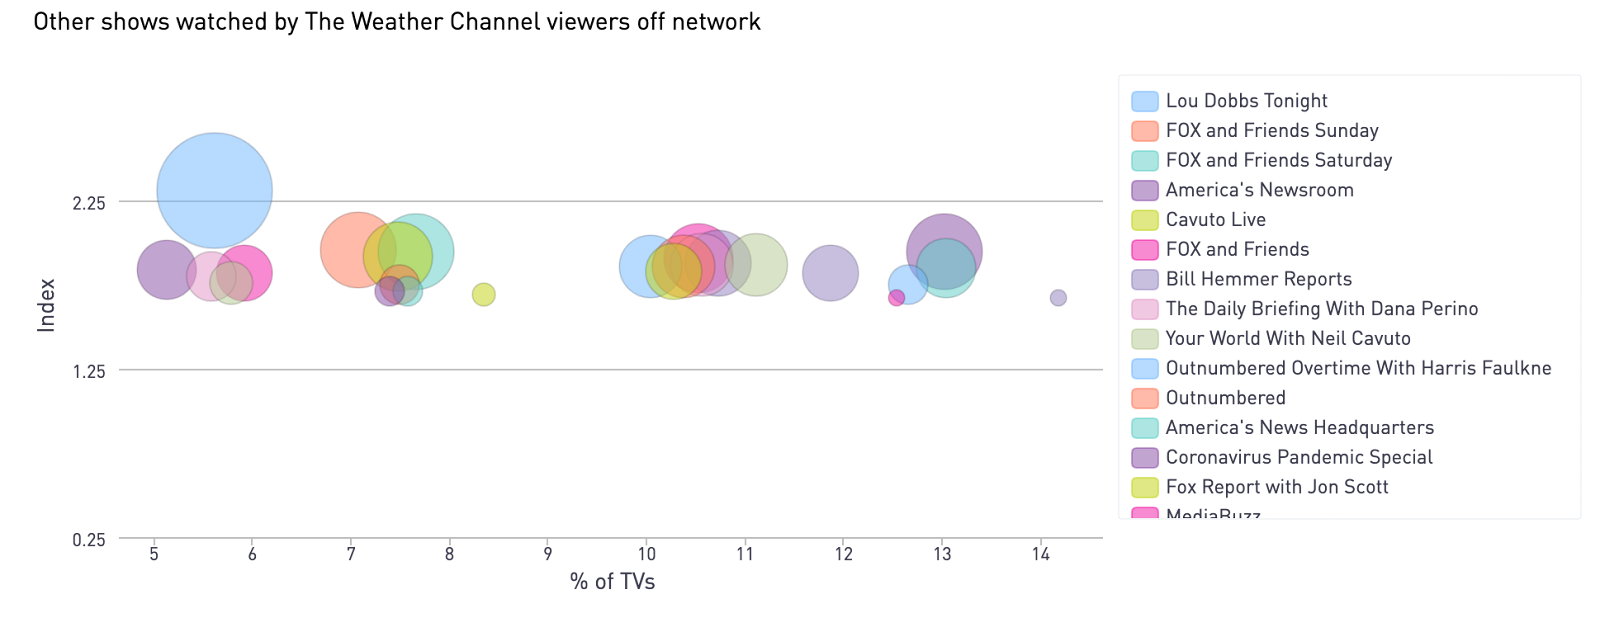
When it comes to specific off-network shows, cable news programs are a popular choice: Lou Dobbs Tonight, FOX and Friends Sunday, FOX and Friends Saturday, America’s Newsroom and Cavuto Live lead.
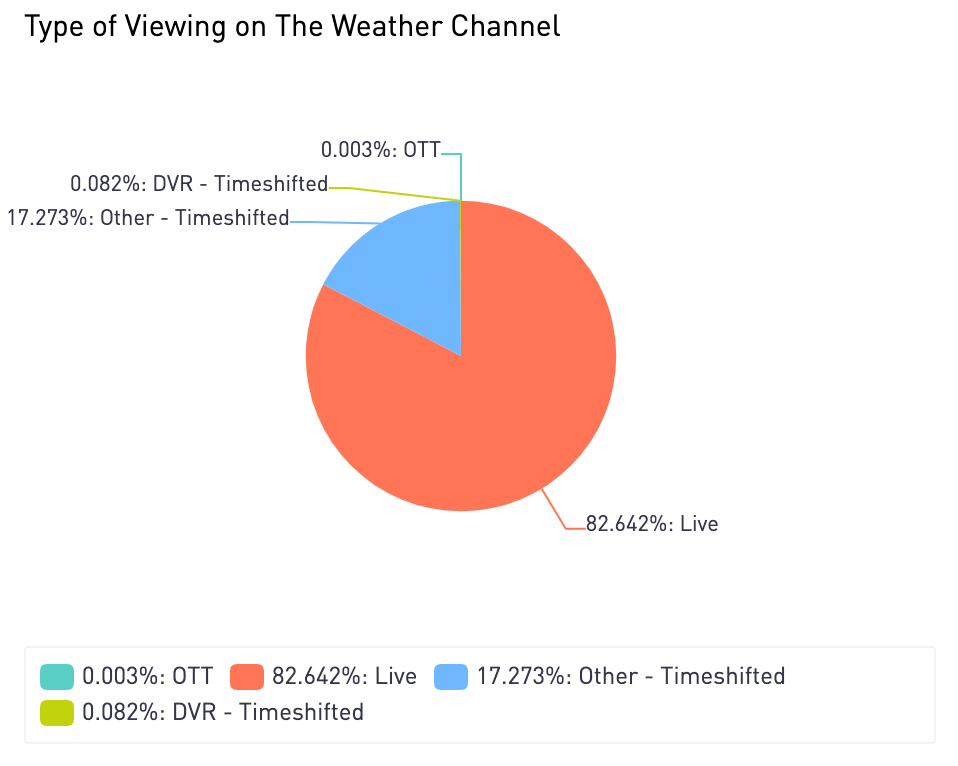
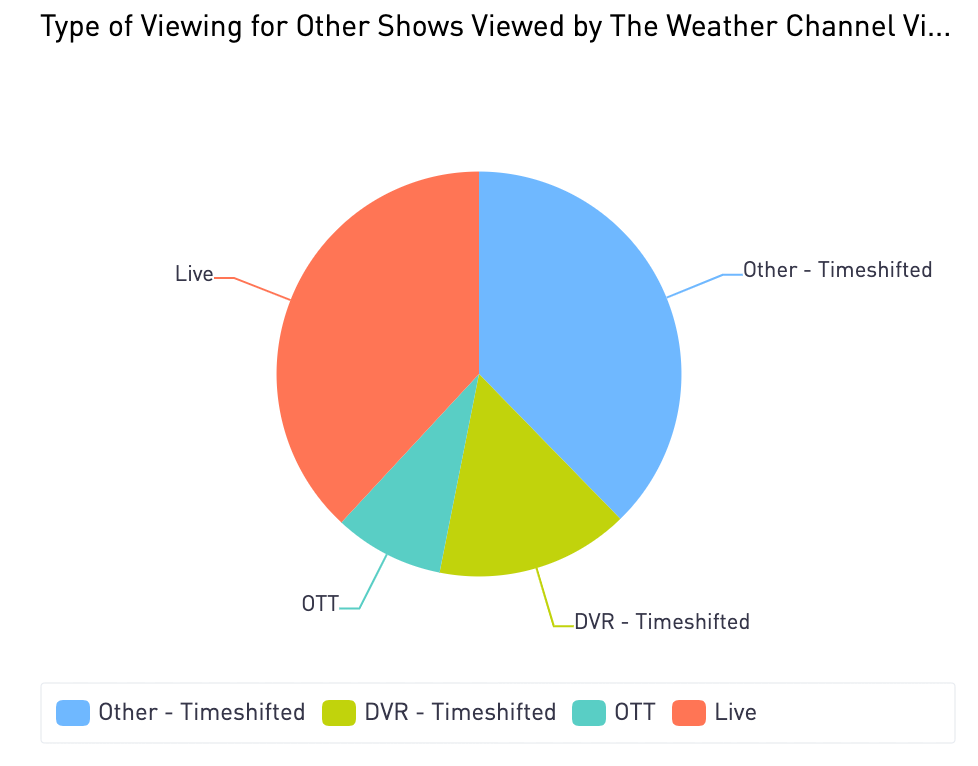
Inscape also measures the type of viewing: live, OTT, timeshifted, etc. Unsurprisingly, the vast majority (82.6%) of The Weather Channel viewing is done live, and 16.9% is timeshifted. But the story shifts a bit when looking at how The Weather Channel viewers consume off-network programming: 38% watch live, 38% watch timeshifted.
Measuring Ad Performance and Business Outcomes With Digital Precision
Meanwhile, iSpot.tv, the always-on TV ad measurement and attribution company, can deliver minute-by-minute readings next day, as well as impression validation for every ad break and every ad, as well as attention analytics (Attention Index* and Attention Score**) for The Weather Channel advertisers.
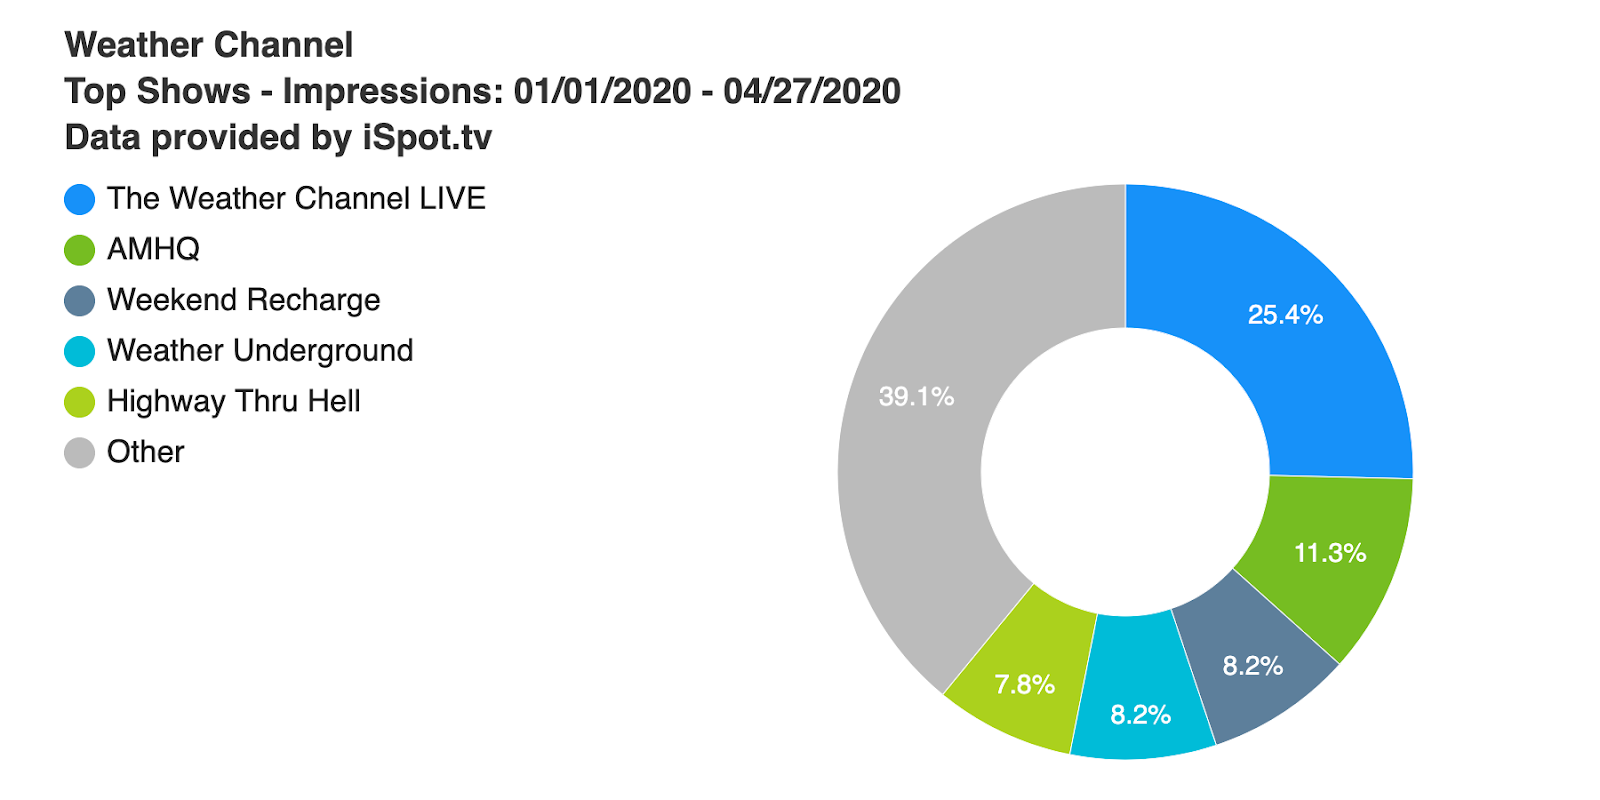
From Jan. 1 through April 27, commercials on the network have generated 10 billion TV ad impressions — a 9.84% increase from the same time period in 2019 — putting it at No. 58 for TV ad impressions so far this year; last year it was No. 63. The top shows driving impressions include The Weather Channel LIVE (2.53 billion impressions), AMHQ (1.12 billion), Weekend Recharge (822.2 million), Weather Underground (818.2 million) and Highway Thru Hell (781.8 million).
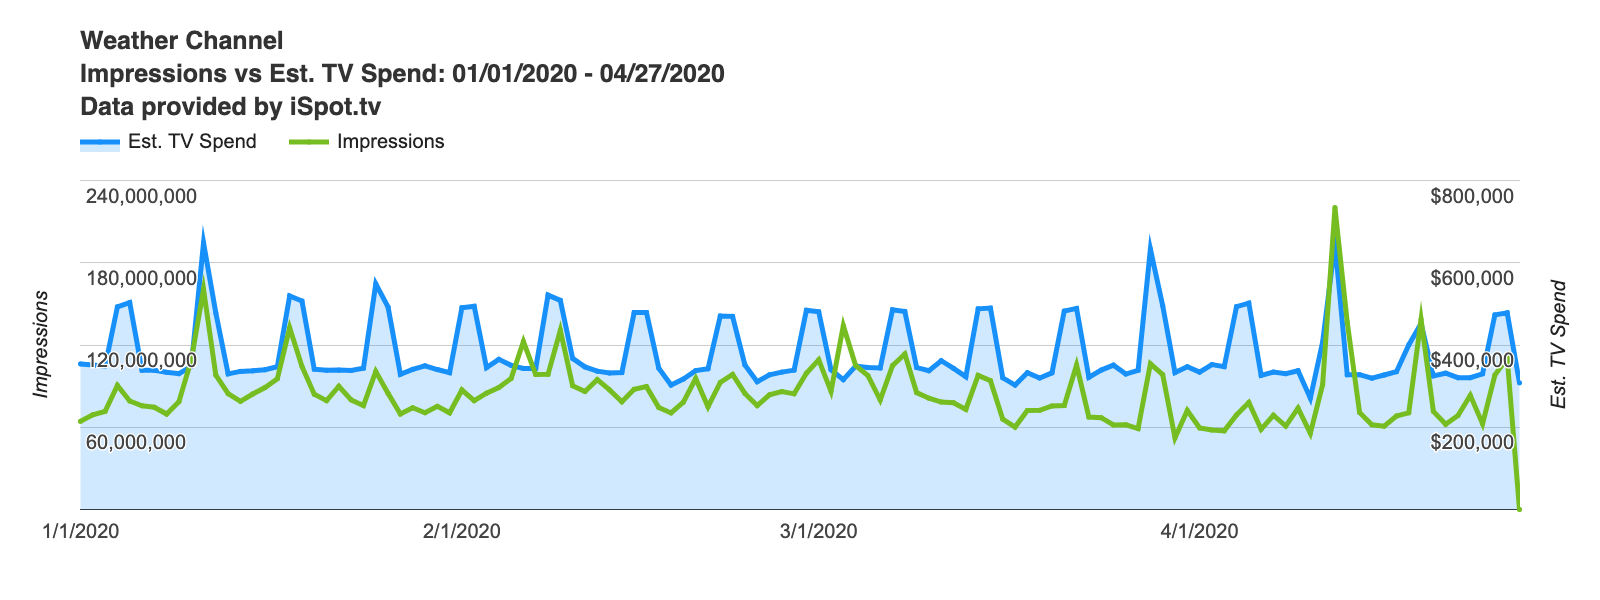
The volume of ad deliveries is easy to map out by genre, show, daypart or by brand or industry. Over time, The Weather Channel ad impressions look like this, with the vast majority of ad impressions (97.3%) occurring live or same-day:
Looking at days and dayparts, Sundays and Saturdays lead with 1.83 billion and 1.66 billion TV ad impressions, respectively. And the top daypart is daytime (1.81 billion impressions), followed by early morning (1.58 billion impressions).
When it comes to holding viewers’ attention during ad breaks, a few of the top brands with above-average attention (among advertisers with a minimum of 150 million TV ad impressions) on The Weather Channel include Cetaphil (ISpot Attention Index: 181, meaning 12% fewer interruptions than average), Domino’s (iSpot Attention Index: 161, so 61% fewer interruptions) and Dish Network (iSpot Attention Index: 135, so 35% fewer interruptions).
Looking at specific spots, one from Cetaphil stood out in particular: “24-Hour Moisture” has received 87.9 million TV ad impressions, with an iSpot Attention Index of 180 (80% fewer interruptions than average) and an Attention Score of 95.44.
While impressions and attention are important metrics for TV advertising, every marketer is ultimately concerned about ad effectiveness. iSpot’s benchmarks, including the iSpot Lift Rating, measure the causal impact of TV advertising on key performance indicators (KPIs); put simply, lift reflects new business driven by TV ad placements.
One recent highlight for The Weather Channel: During March, it delivered a lift of 29.96% for the automotive industry, above the average of 28.55% across all industries and networks that iSpot measured. (The benchmark KPI was consumer visits to auto manufacturer websites, to, for example, research and configure vehicles or look up inventory.)
*iSpot Attention Index - Represents the Attention of a specific creative or program placement vs the average. The average is represented by a score of 100, and the total index range is from 0 through 200. For example, an Attention Index of 125 means that there are 25% fewer interrupted ad plays compared to the average.
**iSpot Attention Score - Measures the propensity of consumers to interrupt an ad play on TV. The higher the score, the more complete views. Actions that interrupt an ad play include changing the channel, pulling up the guide, fast-forwarding or turning off the TV.