
iSpot Data: Q1 National TV Ad Spend Rises 37% Year-Over-Year
After a first quarter littered with big-ticket programming like the Super Bowl, Winter Olympics and March Madness, one might guess that national TV ad spend was up in the first quarter of 2022 compared to Q1 2021. New data from iSpot indicates an increase of 36.9% year-over-year.
Boosted in part by major sporting events and a “return to normal” in Q1 this year vs. last, national TV ads raked in $9.74 billion for networks. Meanwhile, TV ad impressions during the quarter totaled 699.6 billion, up 8.83% year-over-year.
The chart below shows just how crucial tentpole events continue are. NFL games (including February’s Super Bowl) accounted for over 7% of TV ad impressions, according to iSpot. The NFL, men’s college basketball, the Winter Olympics and NBA combined to deliver over 17% of impressions, while SportsCenter — which airs those sports’ highlights — jumps into the top 10 by impressions.
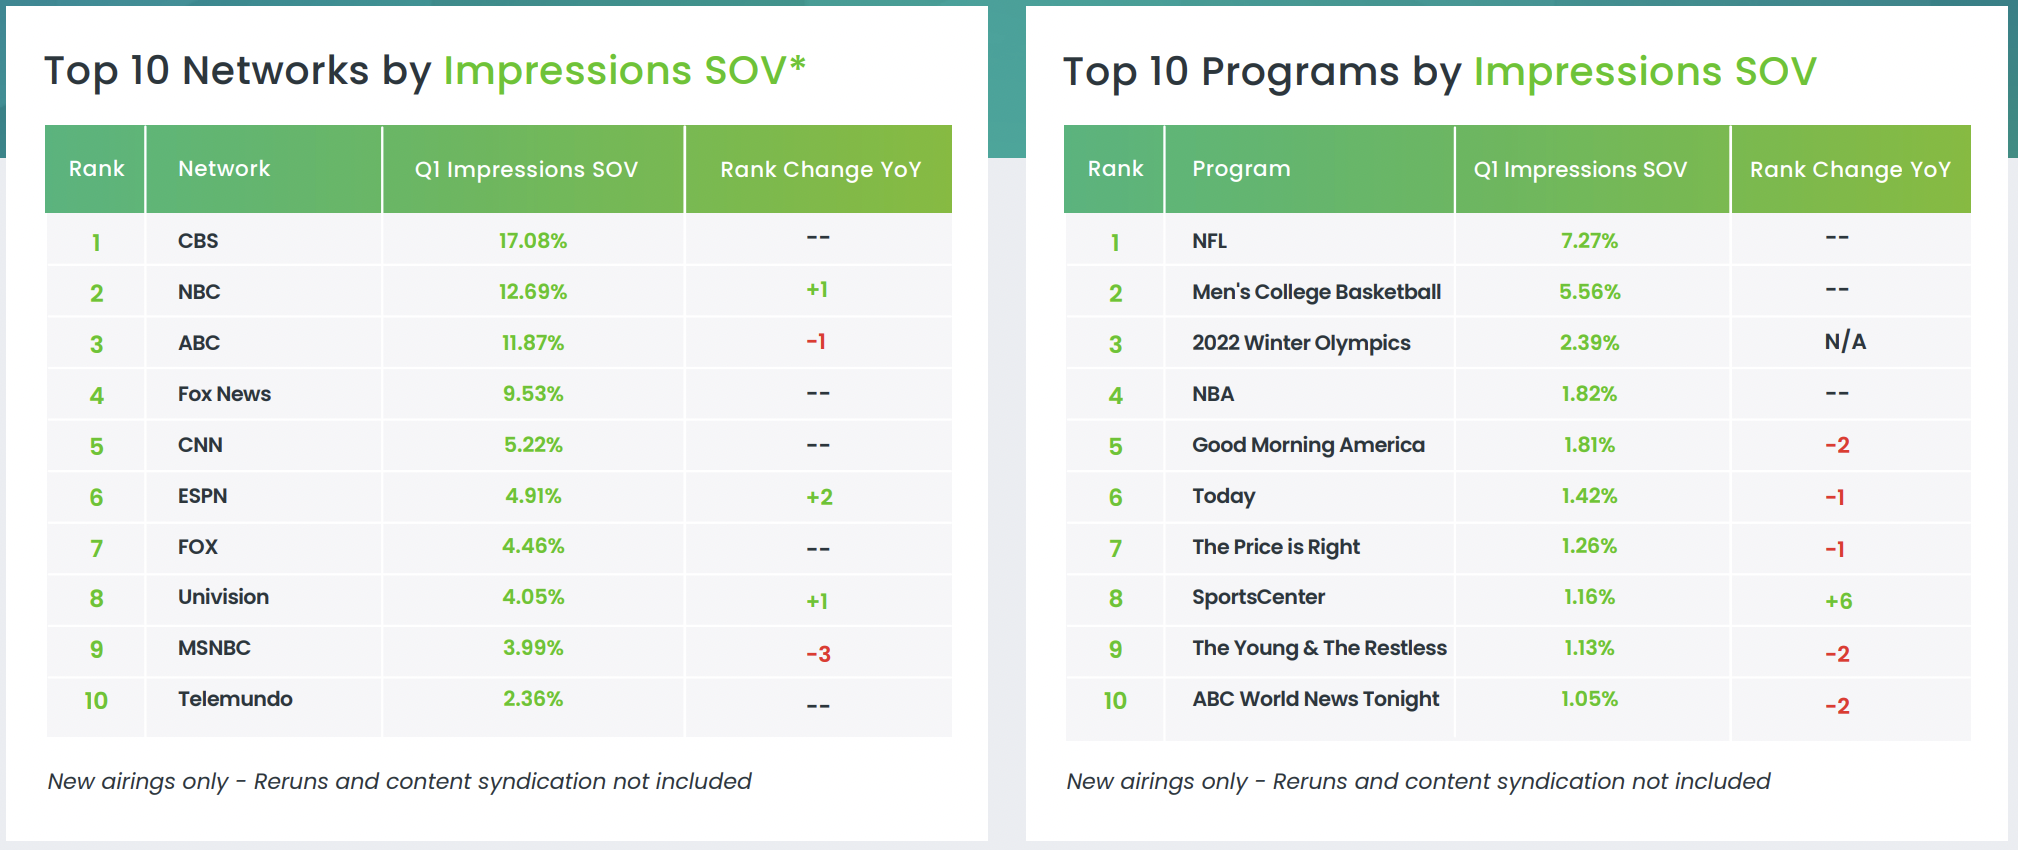
via iSpot
That sort of performance is one of the biggest reasons why the value of sports TV rights continue to balloon. The Big Four broadcast networks (CBS, NBC, ABC, FOX) delivered over 46% of impressions during Q1 2022, and ESPN tacked on another 4.9%. Staying that dominant means retaining the lion’s share of sports rights, so those networks (all owned by the country’s largest media companies) will fork over increasing amounts of money to keep sports like NFL, NBA and men’s college basketball in the fold.
But while the dominance of sports may not surprise, some of TV’s most-seen brands in Q1 (during first-airing programming) were at least a little unexpected. iSpot’s data shows the recruiting site Indeed all the way up at No. 5 by TV ad impressions (up from No. 15 in Q1 2021) as job searches continue to surge. Balance of Nature jumps from No. 31 to No. 7 with an emphasis on cable news, with 87% of impressions coming during Fox News programming.
Despite theatrical releases getting back on track (ad impressions are up more than 100% year-over-year), Disney is also continuing to use linear TV to push Disney+. In Q1, the company’s hero streaming service soared from No. 53 among brand advertisers to No. 17. Nearly 20% of Disney+ impressions in the first quarter were dedicated to Turning Red. But another 20% were dedicated to subscription awareness and/or bundle messaging.
Streaming was one of several top industries to increase its standing among TV’s most-seen for the quarter. While streaming services jumped from No. 6 to No. 4 year-over-year, investment services rose from No. 10 to No. 7 and real estate & mortgage brand impressions share-of-voice climbed from No. 16 to No. 12. As mentioned, theatrical release impressions were up big, migrating from No. 39 to No. 14 year-over-year. Credit cards were big movers as well, from No. 33 to No. 19.
It will be interesting to see if both overall and industry-specific trends hold as we get through Q2.
The Super Bowl and Olympics are some of the most-watched TV programming of the year, which provides an automatic boost to Q1 numbers. Plus, when comparing to 2021, Q1 2022 is taking place in an environment where American life is back to “normal” (versus Q1 2021 when vaccination rollouts were really just getting started). Q2 2022 also has the advantage of a regular primetime TV schedule and the NBA Finals moving back to its normal time period (June), after both were disrupted due to pandemic concerns in Q2 2021.
That’s a conversation for another day (quarter), though. Take a look at iSpot’s full report for more on Q1 in TV advertising.