
Network Spotlight: Advertising and Viewership Trends for ABC
Labor Day has officially come and gone, so it’s time to start looking forward to fall TV. To help usher in the new season, we’re shining a spotlight on the major networks. Today’s focus: ABC.
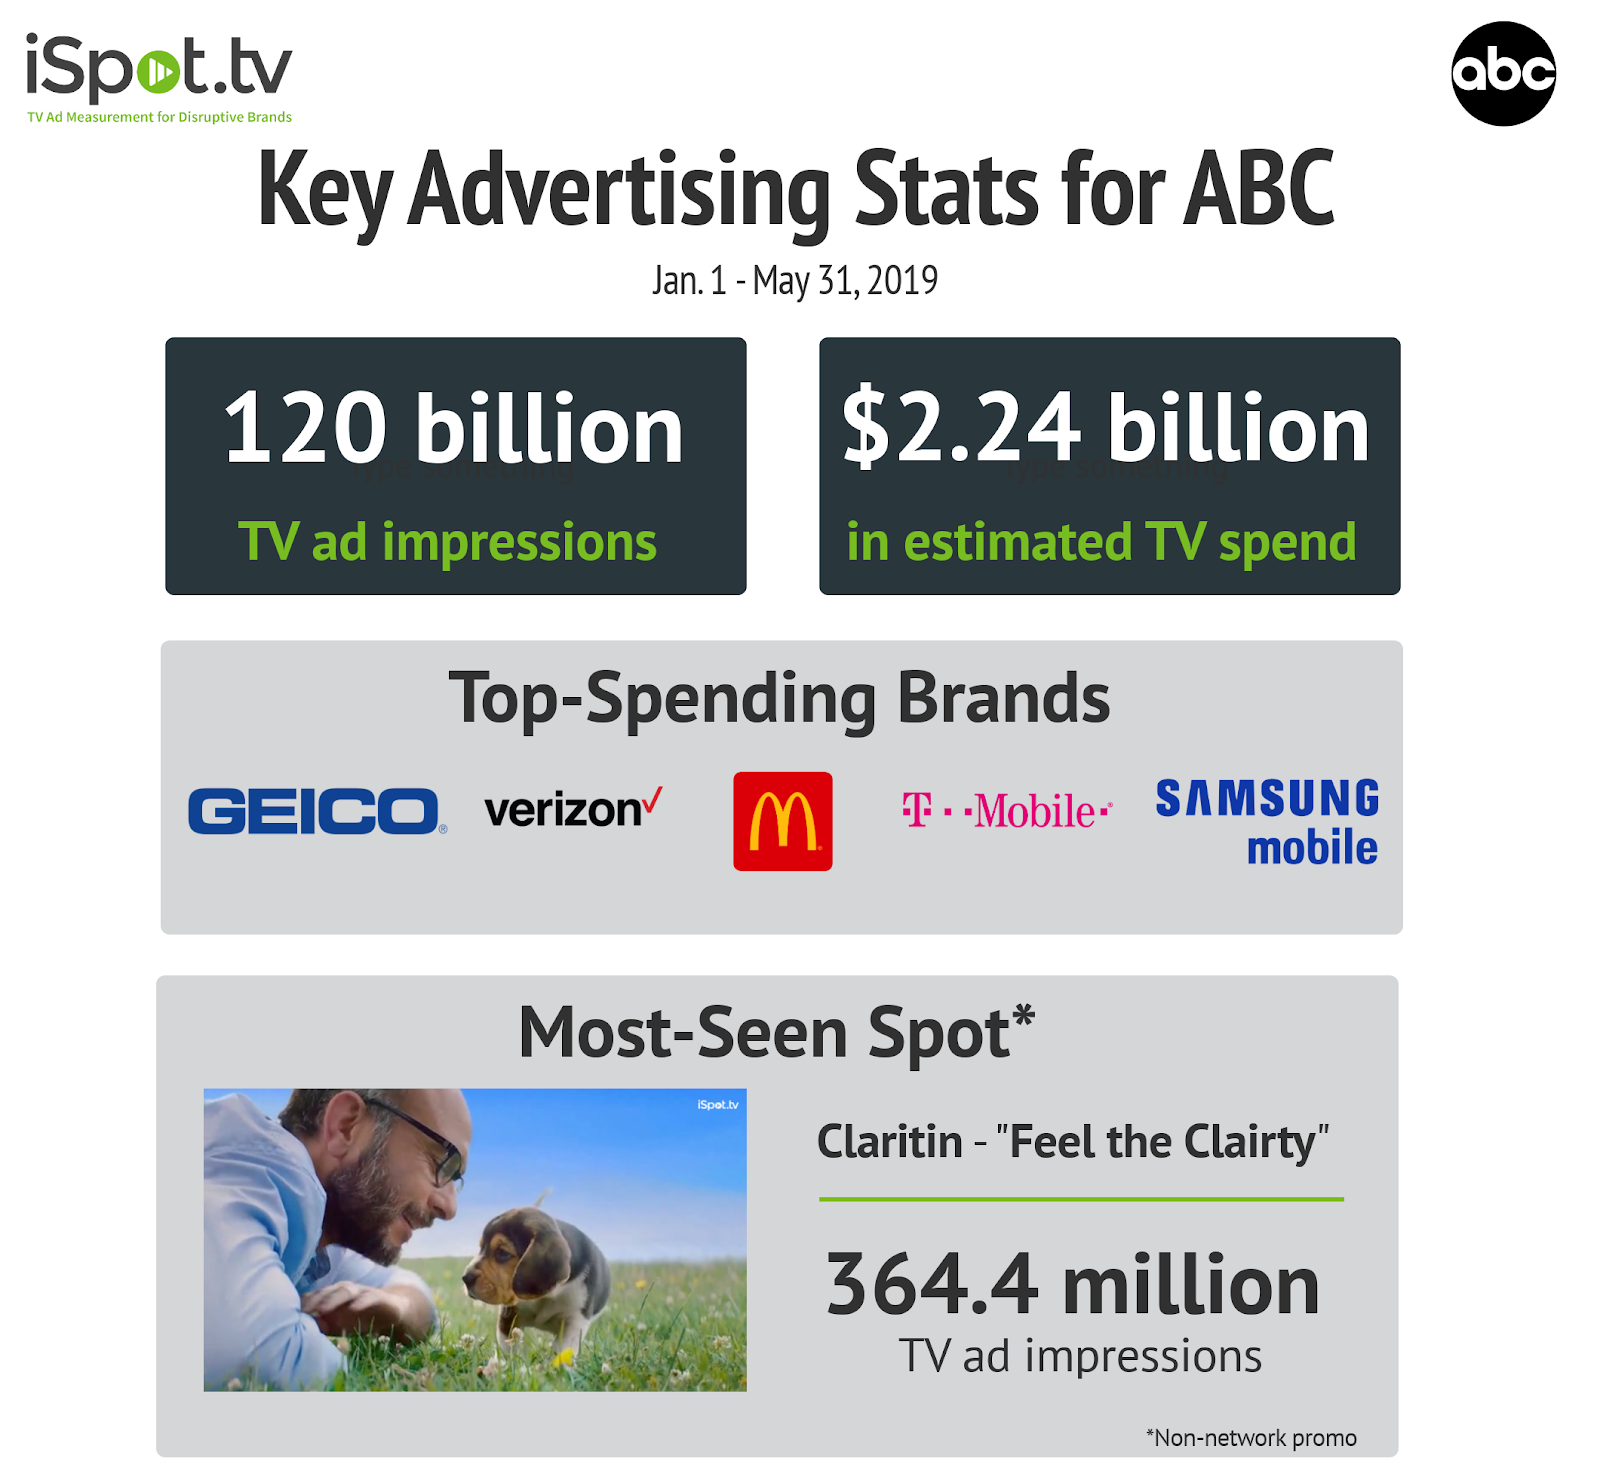
We examined recent advertising and viewership trends from the network (Jan. 1 through May 31, bypassing the summer lull) using data from iSpot.tv, the always-on TV ad measurement and attribution company, and Inscape, the TV data company with glass-level insights from a panel of more than 11 million smart TVs. Also below: the fall ABC shows that are showing lots of viewer interest online according to video measurement company Tubular Labs.
Notable Brands and Spots
iSpot.tv has attention analytics that measure the propensity for viewers to interrupt ad play during a commercial, called the iSpot Attention Index (interruptions include changing the channel, pulling up the guide, fast-forwarding or turning off the TV, and the higher the score, the better).
Three of the most-seen brands with high-attention ads:
- McDonald’s - 1.16 billion TV ad impressions, iSpot Attention Index of 112, meaning its ads received 12% fewer interruptions than average
- Ashley HomeStore - 861.3 million impressions, iSpot Attention Index of 133; 33% fewer interruptions
- Macy’s - 796.1 million impressions, iSpot Attention Index of 116; 16% fewer interruptions
Three of the most-seen high-attention spots:
- Ozempic’s “Arcade” - 299.3 million TV ad impressions, iSpot Attention Index of 153; 53% fewer interruptions than average
- Culturelle’s “Finally” - 290.9 million impressions, iSpot Attention Index of 104; 4% fewer interruptions
- Seresto’s “Whatever Your Dog Brings Home” - 251.5 million impressions, iSpot Attention Index of 105; 5% fewer interruptions
Attention Trends by Daypart and Day of the Week
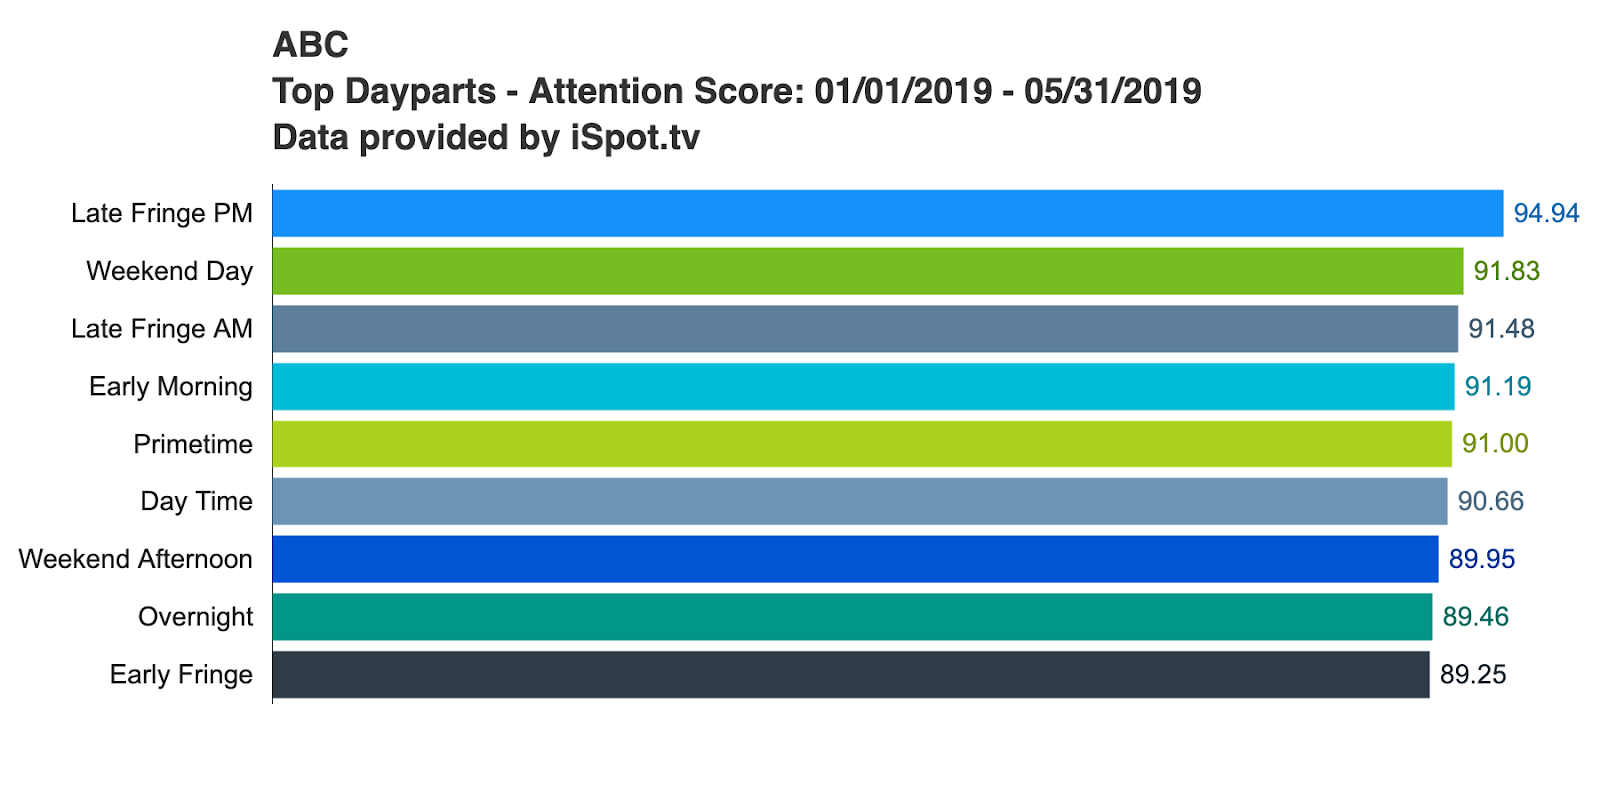
We also looked at attention trends by daypart and day of the week using the iSpot Attention Score, which gives the average percentage of an ad that is played across TV devices. Looking at daypart, the highest iSpot Attention Scores on average came from late fringe PM (94.94), weekend days (91.83) and late fringe AM (91.48).
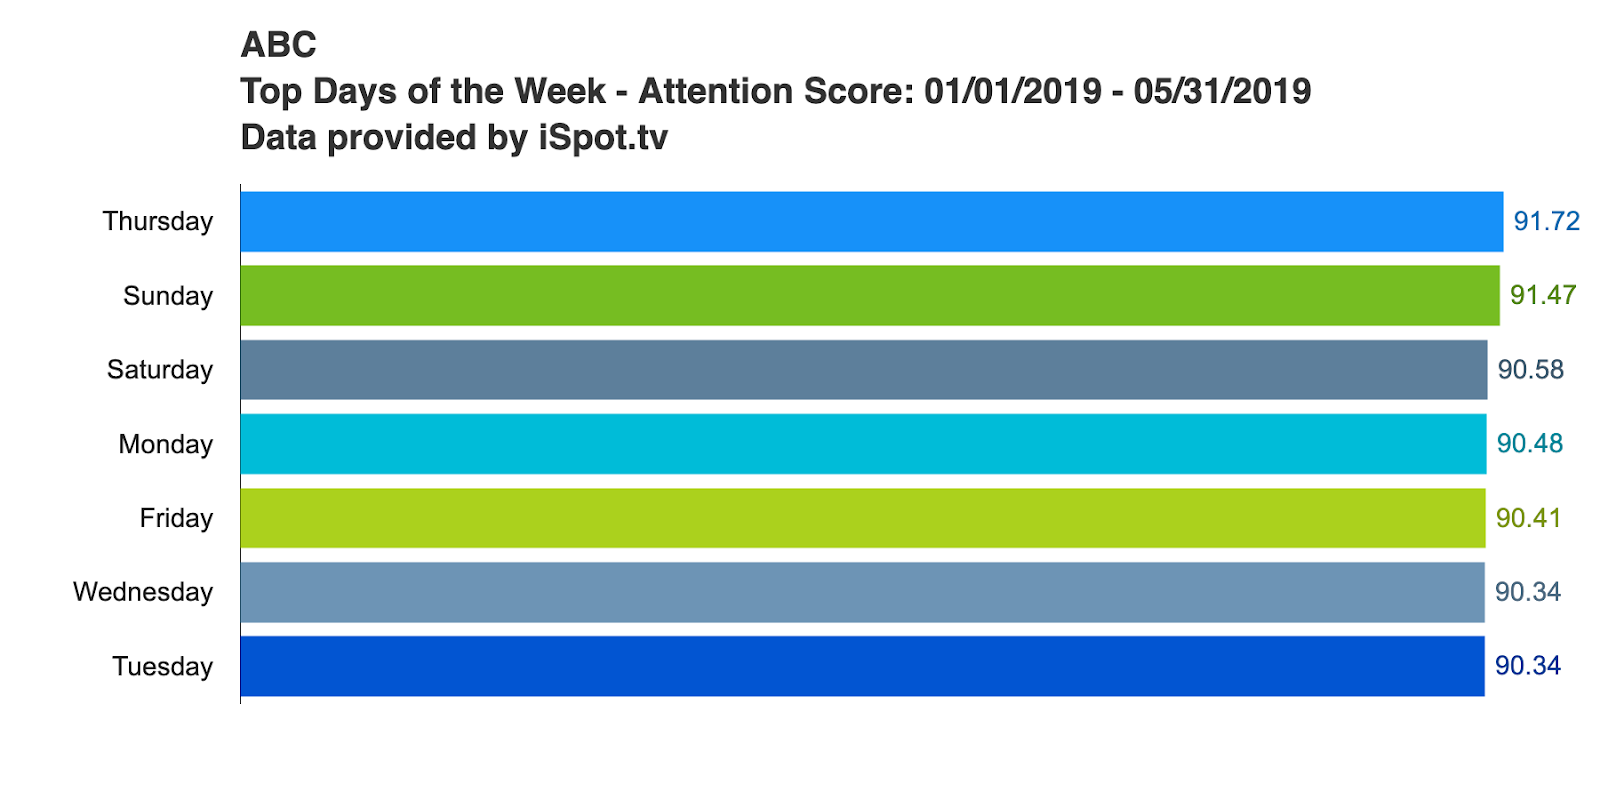
There was a fairly consistent iSpot Attention Score across days of the week, with Thursdays and Sundays slightly winning out (91.72 and 91.47, respectively).
Viewership Insights
We looked at viewer trends across some of ABC’s major shows using insights from Inscape, including show crossover and season-over-season crossover.
First, a look at the percentage of crossover among five hit of its series: The Bachelor, The Conners, Grey’s Anatomy, American Idol and Modern Family. A note about methodology: You have to do more than just flip past a station with your remote to count as a “crossover viewer” in Inscape’s system. For the data below, the minimum viewing threshold is ten minutes.
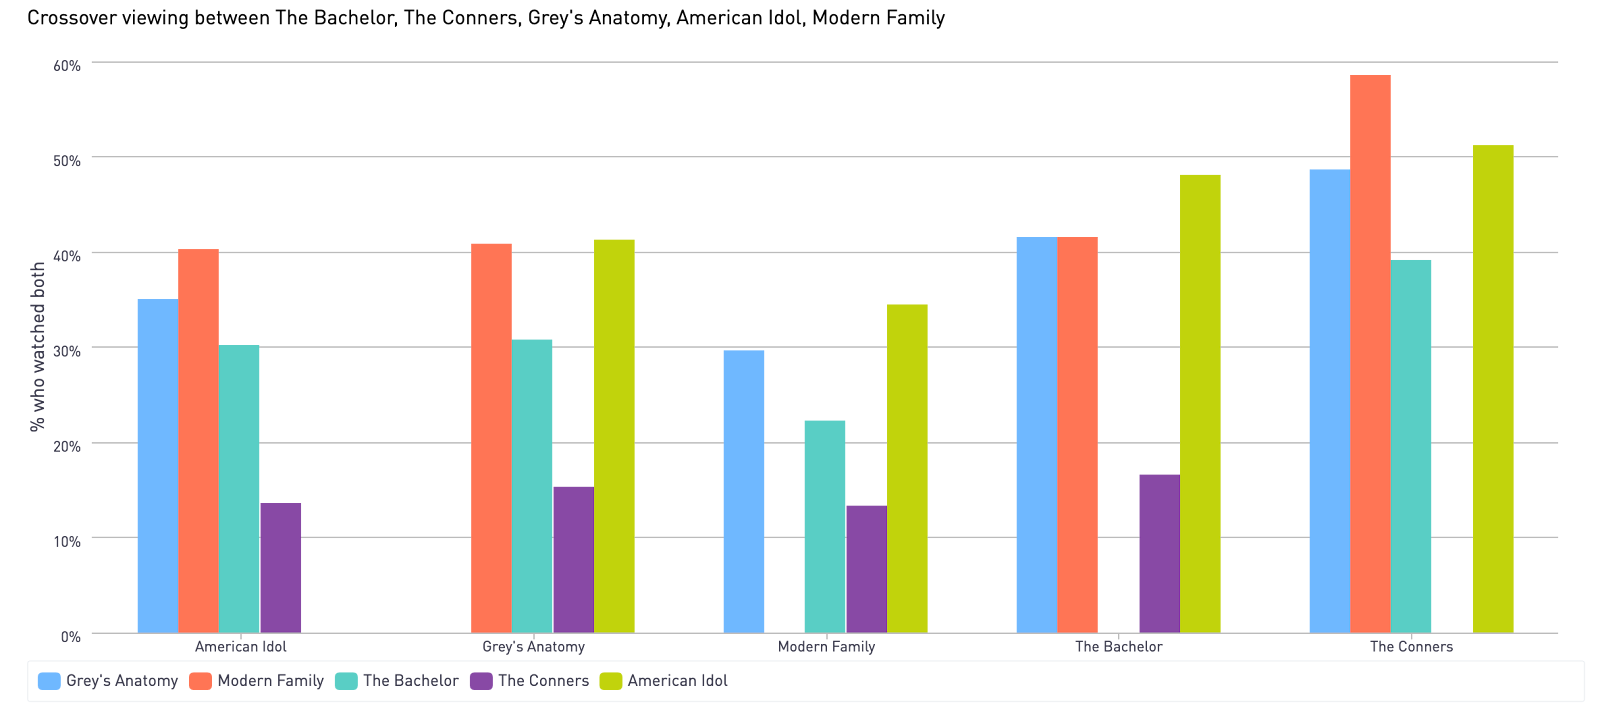
Overall, there was low crossover with The Conners for the other shows: 13% of Modern Family fans, 14% of American Idol viewers and 15% of people who watched Grey’s Anatomy tuned into it. On the flip side, 59% of The Conners viewers tuned into Modern Family — the highest crossover rate on the chart.
Speaking of Modern Family, this Emmy-winning, mockumentary-style sitcom is about to embark on its eleventh and final season, set to premiere on Sept. 25. We took a look at its audience loyalty with a season-over-season crossover analysis.
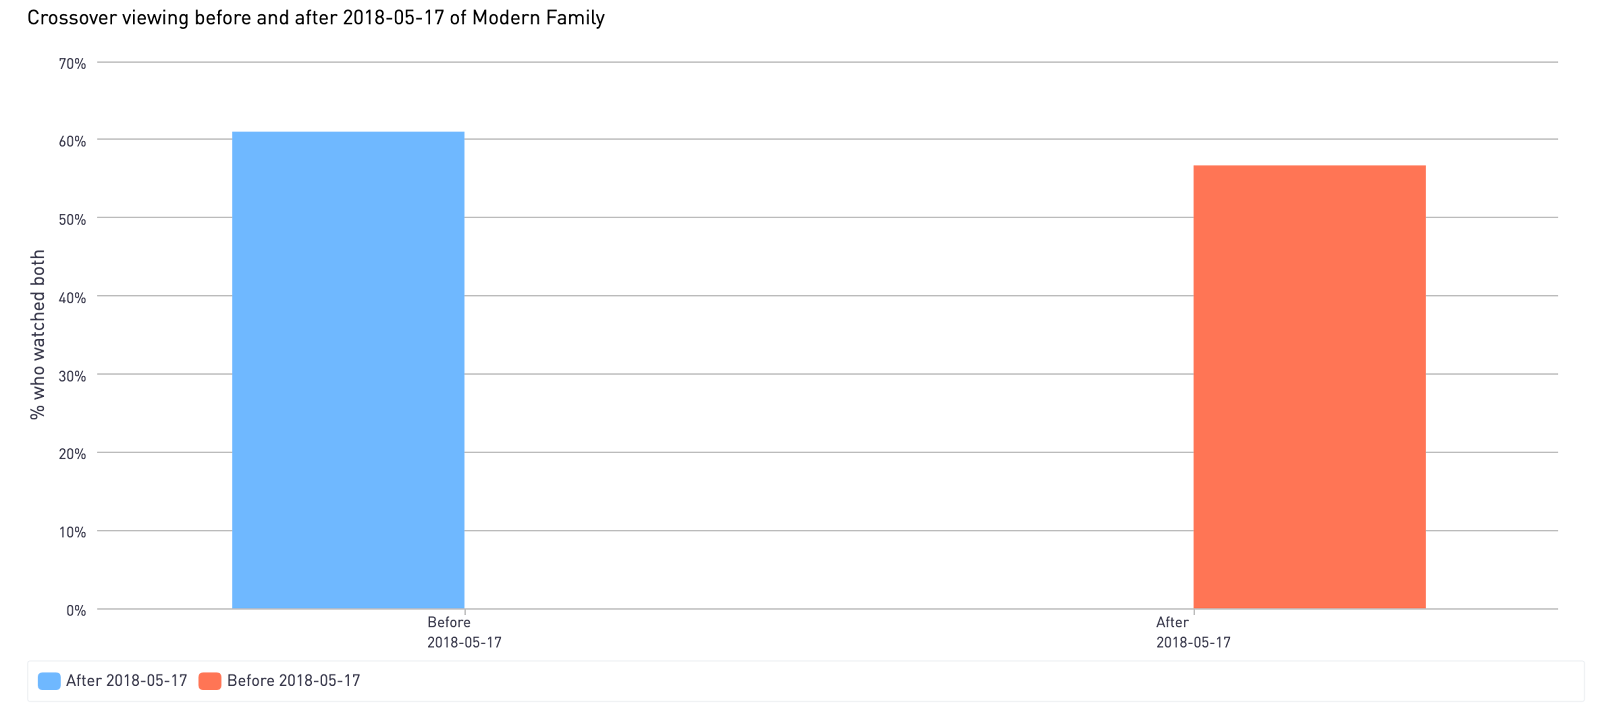
Of the fans who watched season nine (Sept. 27, 2017 through May 16, 2018), 61% came back for season ten (Sept. 26, 2018 through May 8, 2019). For season-ten viewers, 57% had watched season nine.
What’s poised to be big in 2019?
Though it’s impossible to entirely predict which shows will be most successful this fall, one hint lies in the impressions for trailers (i.e., high impressions = the network putting big bets on a given show) that have aired this summer. Looking at data from iSpot, we can see the most impressions delivered by trailers for the following ABC shows from July 1 through Aug. 15:
- Emergence (512.2 million)
- Stumptown (484.3 million)
- Mixed-ish (322.2 million)
Data from video measurement company Tubular Labs expands that view further by gauging the popularity of trailers for ABC shows across social platforms including Facebook, YouTube, Twitter and Instagram.
Black-ish spinoff Mixed-ish leads the way with its trailer making up two of the top 15 ABC videos since May 1 for a combined 8.9 million views. Sci-fi thriller Emergence, featuring Allison Tollman, Clancy Brown and Donald Faison, earned 4.3 million views for its official trailer, posted on YouTube, followed closely by Cobie Smulders-led Stumptown (the YouTube trailer had 4.1 million views). The Facebook trailer for the revived Kids Say the Darndest Things with Tiffany Haddish had 2.9 million views.
When looking at returning ABC favorites, trailers for American Housewife (3.8 million views) Marvel’s Agents of Shield (2.3 million) and How to Get Away with Murder (2 million) led the way. Long-running Grey’s Anatomy also picked up 1.9 million views for its season 16 trailer.
Photo by Kushagra Kevat on Unsplash