
Tubular Launches Amazon Shopping Data For Social-Video Viewers
Content creators, publishers, brands and agencies can now better understand what viewers of social videos are shopping for on Amazon thanks to new tools introduced today from Tubular Labs.
Tubular Consumer Insights connects Amazon shopping data to the company’s firehose of data about audiences for about 10 billion videos on Facebook, Instagram, YouTube, Twitter and Twitch. It connects Tubular’s existing data and audience ratings for those views of content from about 250,000 creators ranging from big media companies to individual influencers.
“The launch of Tubular Consumer Insights represents the most definitive, expansive view into the consumer purchase journey from social video to consumption,” said Tubular CMO Josh Schmiesing. “This breakthrough offering, for the first time, allows brand marketers and media companies to connect cross-platform video viewership to buyer behaviors.”
Schmiesing said it's useful to think of the new data layer as another important step in creating verifiable market attribution for viewer activity in response to what they’re watching. The new data tracks both actual purchase behavior and viewers’ propensity to shop for and buy other kinds of products.
“So we can take that same audience and then have shopping behaviors, whether it’s purchase or browsing,” Schmiesing said. “And what’s interesting is that it’s based on Amazon categorization, so you can work your way from something as high(-level) as ‘consumer electronics,’ all the way down to something as specific as, say, ‘soundbar,’ and look for matches and engagement with that audience, across creators and publishers.”
Two big groups are expected to embrace the possibilities in the new data.
One such group consists of publishers, influencers, media companies and similar content creators trying to understand what their audiences (or competitors’ audiences) are shopping for. That data can inform what shows or topics the creator focuses on.
The publisher/creator group also might use the data to find potential brands and product sectors to partner with, either as advertisers or sponsors, Schmiesing said.
“We can take the creators themselves, whether that's MTV or MrBeast, and I could tell you what those audiences are buying,” Schmiesing said. “We can also take a category like the Olympics, and I can tell you (what) audiences (are buying), who are watching Olympics content across all kinds of creators, whether it's NBC or somebody else. I can tell you what people who are watching that content are buying, or shopping for.”
On the flip side, the other group that would find this data invaluable are brand marketers, agencies, and other advertisers. For them, the data can uncover sites and creators most likely to be good fits for the audiences they want to reach, especially creators whose audiences over-index for their products or product categories.
The data also can be a resource to better spot the influencers brands and agencies should sign sponsorships and other partnerships with, to build longer-term relationships with particularly well-targeted audiences.
An early-access program testing the new data in beta mode turned up plenty of surprising connections, Schmiesing said.
As one example, he pointed to viewers of content about Netflix’s hit Korean horror series Squid Game, who are (slightly improbably) also fans of dance contests, Pepsi and the singer Adele.
On the eve of the Winter Olympics in Beijing, another example Schmiesing cited: 30% of Olympics social-video viewers also shop for “home & food” items on Amazon, data likely to be useful to the CPG companies of the planet.
Another example: people who watch home-automation videos are a whopping 36 times more likely to shop for cleaning supplies on Amazon, according to Tubular.
Product categories with the highest percentage of social-video audiences in the last quarter include: Electronics (19%), Computers & Accessories (14%), Home & Kitchen (13%), and Clothing, Shoes & Jewelry (12%).
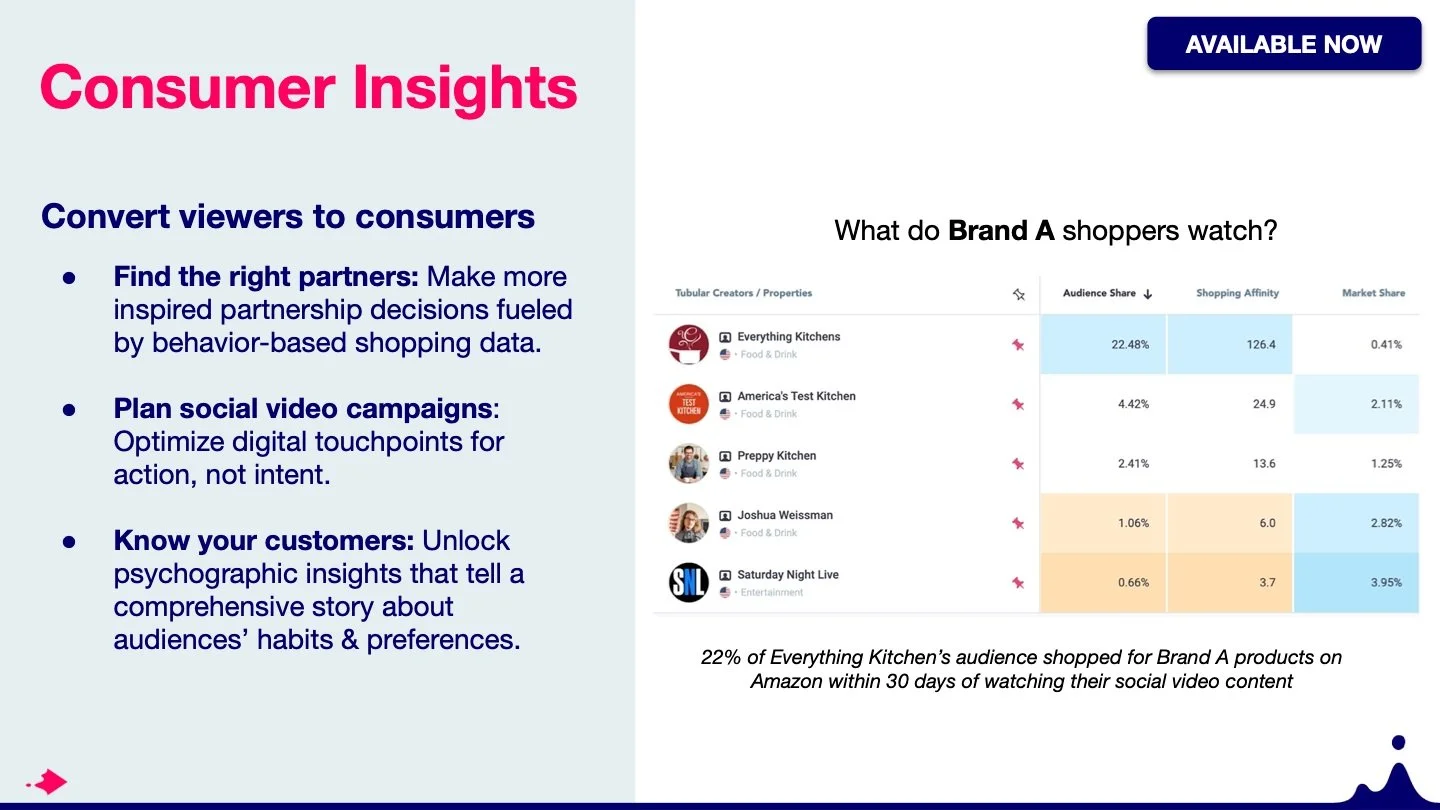
Measurements include “Shopping Affinity,” the likelihood an audience will shop for a specific product or category; “Audience Share,” the percentage of viewers who shopped for a product or category within 30 days of watching; “Market Share,” the percentage of shoppers in a category who also viewed that creator or category; and “Relevance Score,” which normalizes shopping affinity scores for small audiences.